
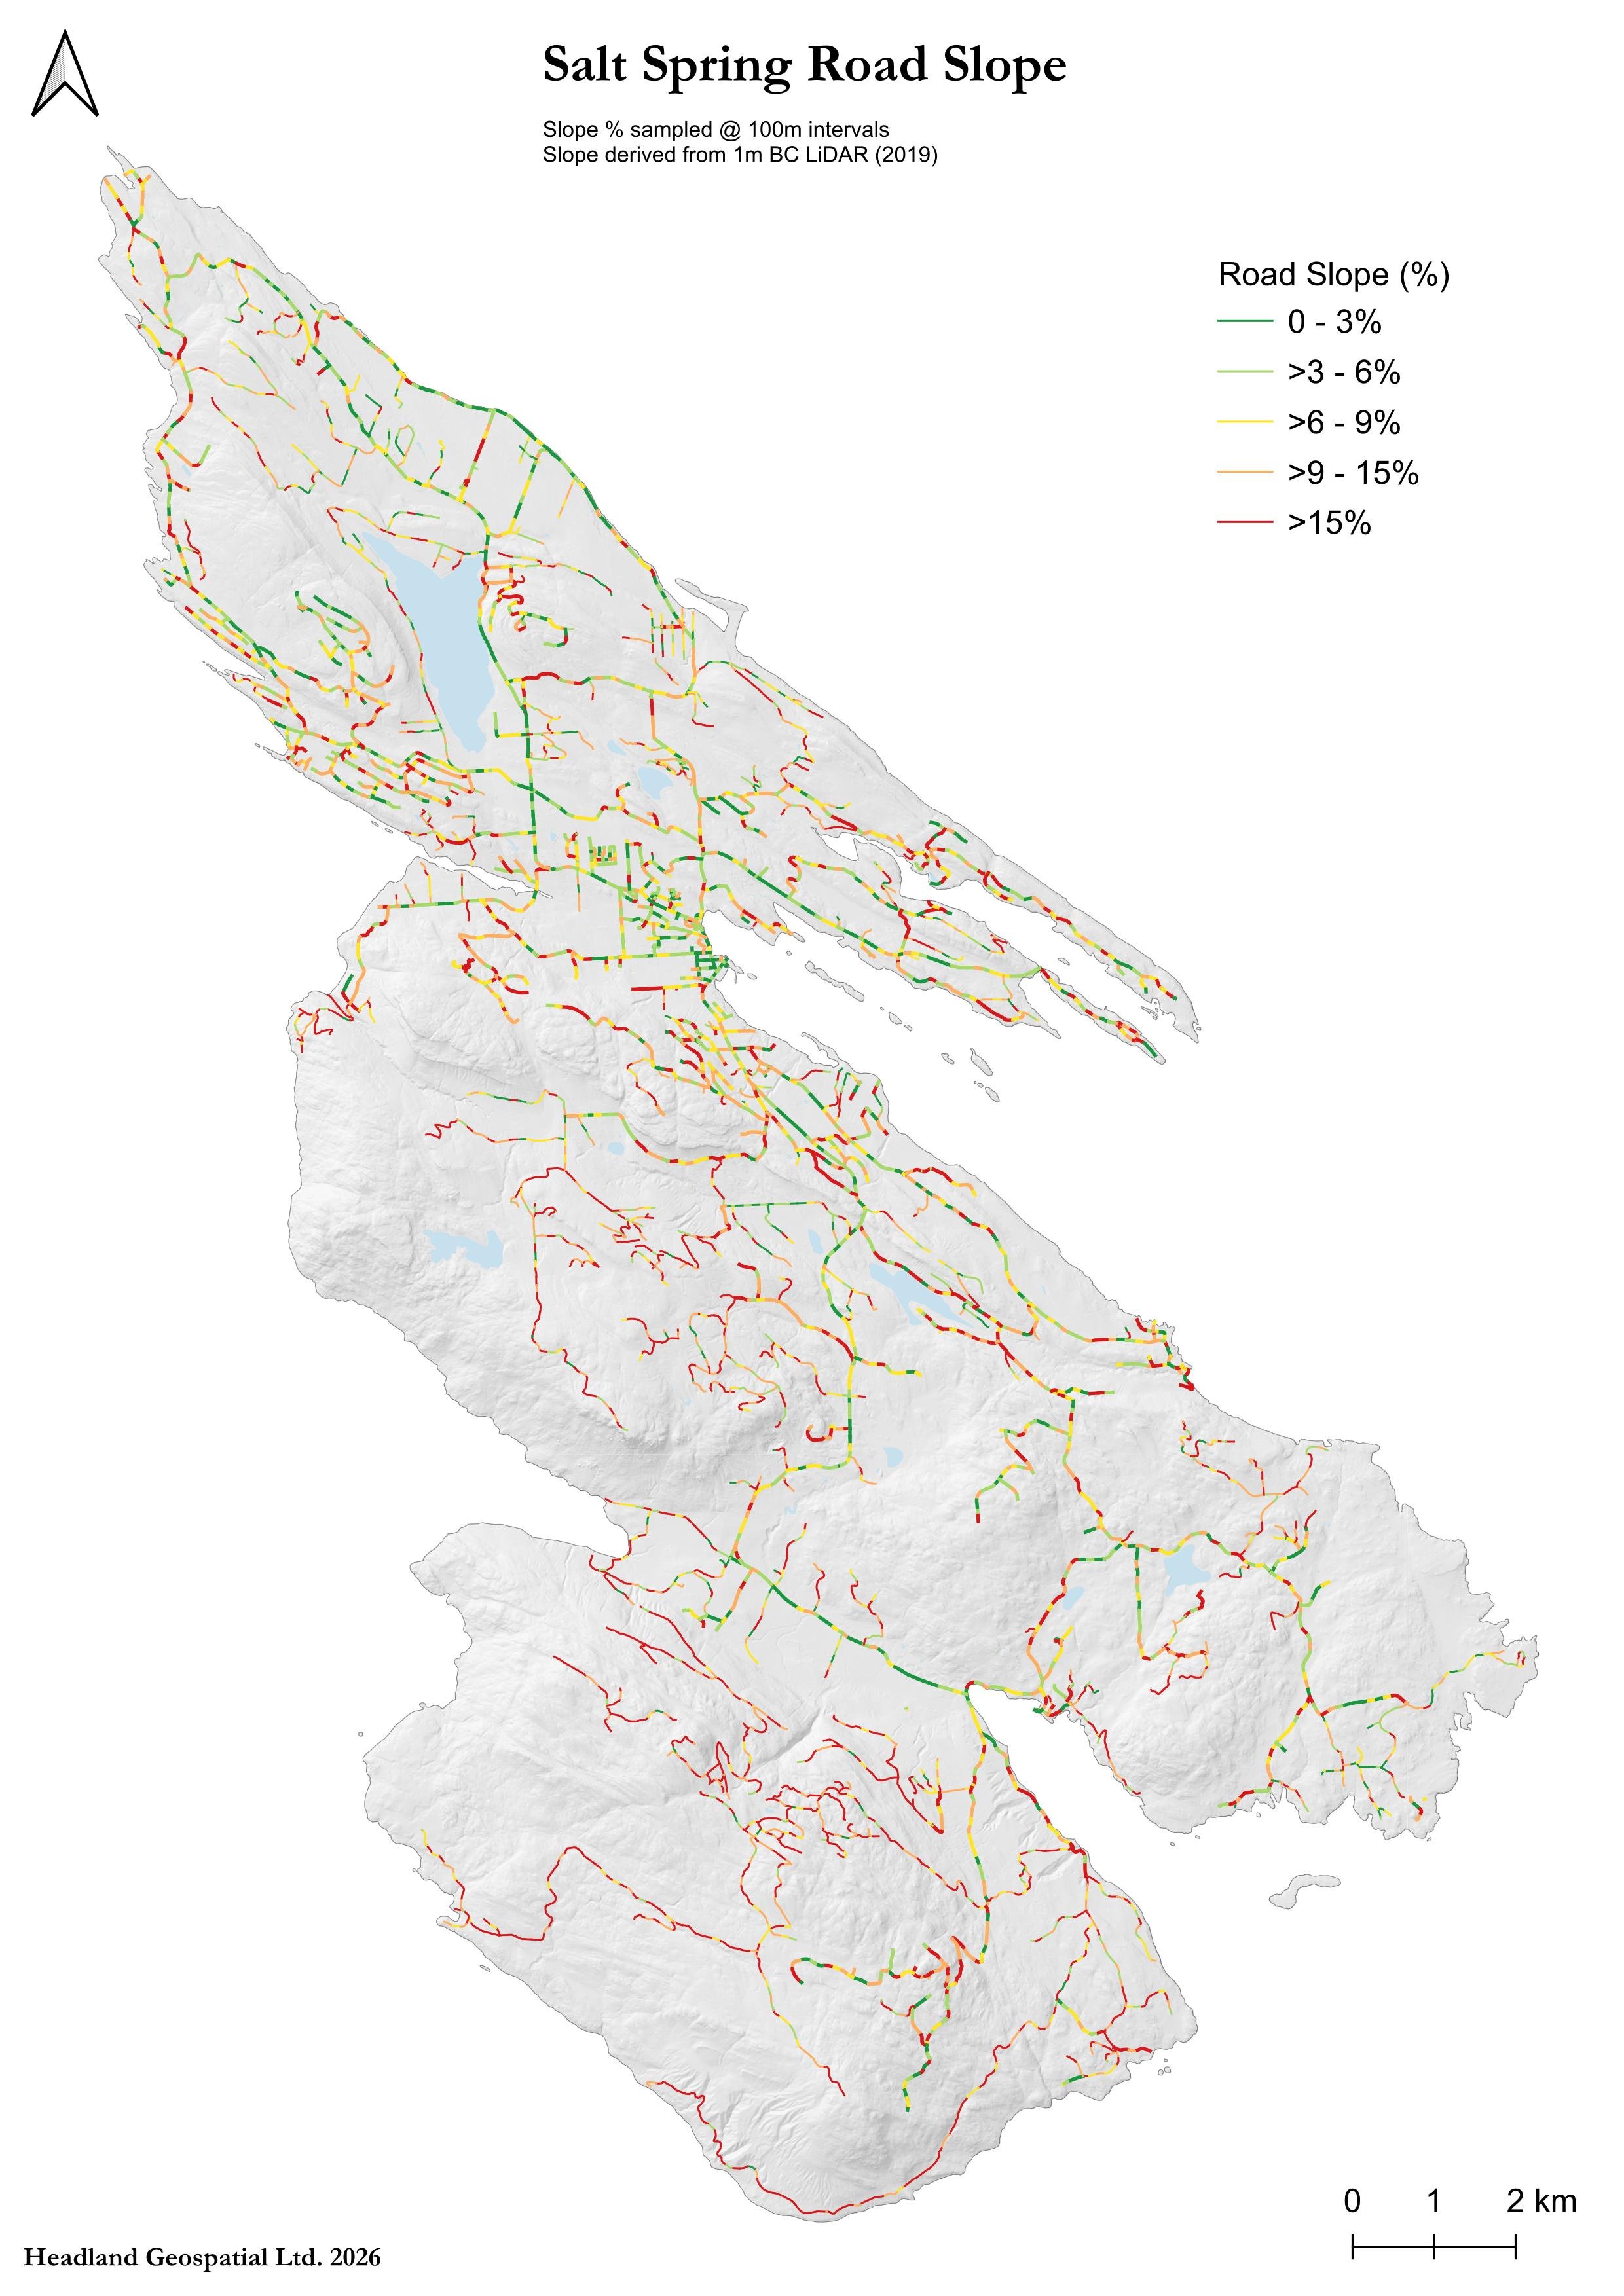
Extracting Per-Segment Road Slope from a 1m LiDAR DEM: a Salt Spring Case Study
Ever feel like you're always cycling uphill on Salt Spring Island? Using the BC LiDAR 1m DEM, I extracted slope across the entire island and cut the SSI road network into 100m segments, sampling the slope at the midpoint of each one. Those values were then colour-coded by difficulty from green for the easy stuff, to red for the suffer zones, assuming you're going uphill..
This workflow was run through QGIS using vector and raster tools.
Note on analysis: Some areas are worth looking at with more samples per 100m, and either averaging the samples or creating shorter segments. There are areas, noticeably the section above Hepburn hill, that this samples as a >15% slope (likely due to small sloped area being sampled in the middle of a larger flat section) that in reality is a couple hundred meters of flat road. If I was to redo this analysis, I would likely first break the 100m segments down into a few smaller points (5?) and sample at 20m intervals instead. Then average the slope across 20m and reattach that slope to each 100m segment to reduce the affect outliers would have on the result.
Leh Smallshaw